Environmental Grand Design Achievement of the Environmental Grand Design
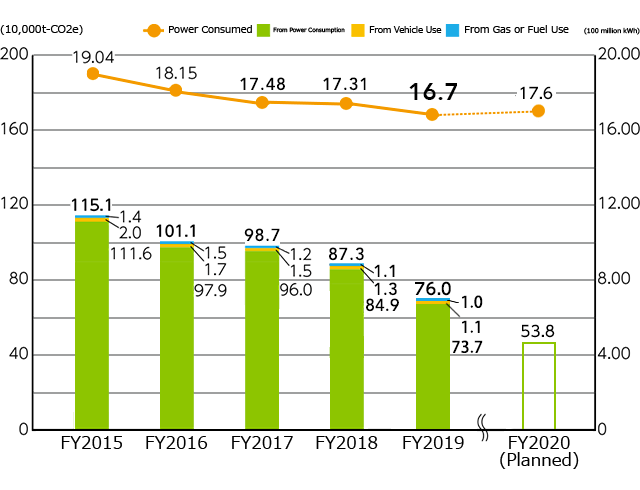
 Measures against Climate Change- Reduction of Greenhouse Gas Emission
The key factors that contributed to greenhouse gas (GHG) emission by NTT West Group are electric power consumption, vehicle use and the use of gas and fuels, among which a large part comes from power consumption. In FY2019, power consumption has been reduced by approximately 60 million kWh compared to FY2018.
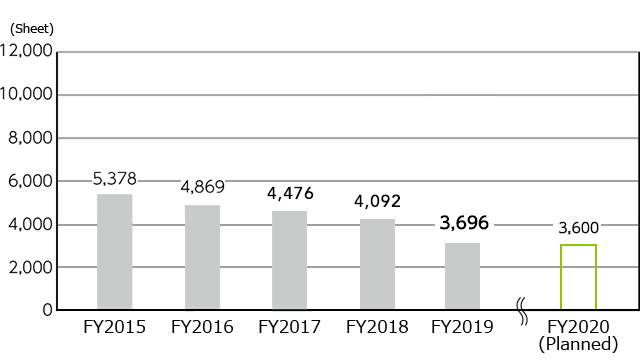
 Reduction of Environmental Load- Reduction of Paper Use
At NTT West Group, paper is used for telephone directories, invoices, office paper and telegraphs.
The total amount of paper used in FY2019 was 10,200t, which included 8,200t for telephone directories, 900t for invoices, 900t for office paper and 200t for telegraphs. We have been minimizing the use of paper by implementing thorough efforts such as holding paperless meetings and establishing a system for paper used within the company. At the same time, we are also getting cooperation from our customers to reduce paper use such as by imposing a charge on paper bills.
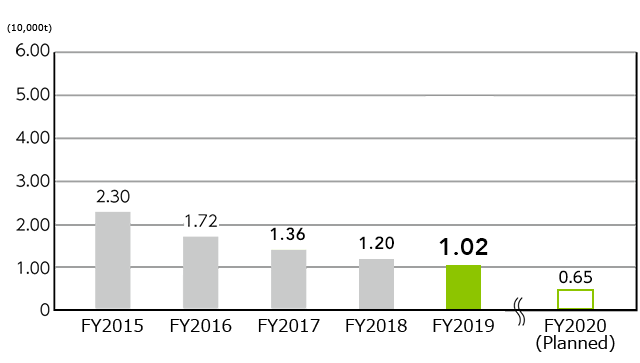
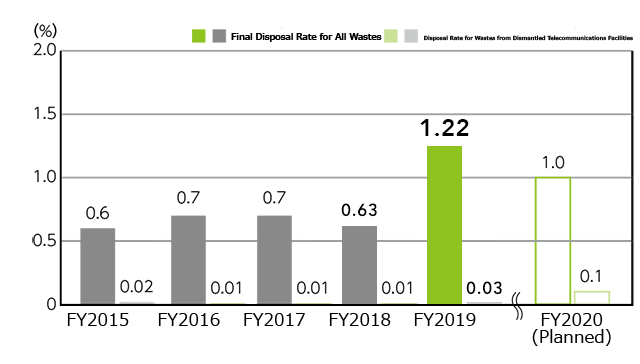
Reduction of Final Waste Disposal Rate
Wastes include those from dismantled telecommunications facilities, civil engineering projects, construction projects and office work.
The final waste disposal rate for FY2019 was 1.22%*, and we were not able to achieve zero emissions.
For the breakdown, the final disposal rate for wastes from dismantled telecommunications facilities was 0.03%, while that for civil engineering projects, construction projects and office work were 0.89%, 1.95%, and 0.78% respectively.
- *Final amount of disposal (2,500t) テキ Amount of wastes (201,000t)
Final Waste Disposal Rate