Environmental Grand Design Achievement of the Environmental Grand Design
Reduction in Power Use
In FY 2016, the amount of power used by the NTT West Group was reduced by about 90 million kWh compared to FY 2015, which leads to a reduction of 140,000 t-CO2e compared to FY 2015 in terms of the total GHG emission. This is equivalent to the amount of CO2 that can be absorbed by about 10 million Japanese cedar trees in a year.
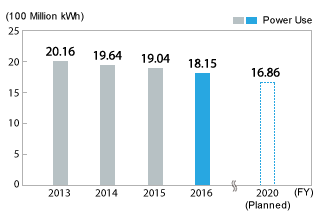
- (Note) This value is calculated by NTT West Group based on the weighted average of the emission factor released yearly by electricity providers according to the amount of power used by the respective providers.
Reduction of Paper Use
At NTT West Group, paper is used for telephone directories, invoices, office paper and telegraphs. The total amount of paper used in FY 2016 was 17,200t (*), which included 13,900t for telephone directories, 1,700t for invoices, 1,300t for office paper and 300t for telegraphs.
We will minimize the use of paper by implementing thorough efforts such as holding paperless meetings and establishing a system for paper used within the group companies, while at the same time adopt measures such as imposing a charge on paper bills by gaining the cooperation of our customers.
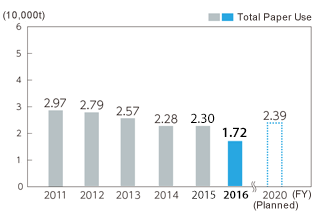
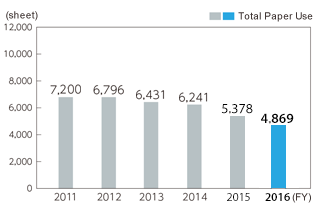
- *Starting from this fiscal year, we have revised the approach for calculating the numeric values that appear in the report.
Reduction of Final Waste Disposal Rate
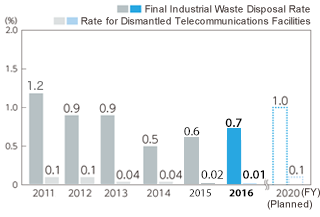
Industrial wastes are generated mainly from dismantled telecommunications facilities, civil engineering projects, construction projects, and office work.The final industrial waste disposal rate for FY 2016 was 0.7%, and we achieved zero emissions for the fifth consecutive year since FY 2012. For the breakdown, 0.01% was from dismantled telecommunications facilities while civil engineering projects, construction projects, and office work generated 0.9%, 1.2%, and 0.6% respectively.
Final Industrial Waste Disposal Rate